


Overall gain is driven by rise in share of higher-income immigrants who have lived in the U.S. for more years
The Great Recession of 2007-09 triggered a lengthy period of decline in the incomes of American workers. Since hitting a trough stretching from 2012 to 2014, their financial fortunes appear to be on the mend – in 2017, a decade after the recession began, the median personal income of American workers stood 3% higher than in 2007.1
On the surface, a similar recovery appears to be underway for Latino workers.2 Their median personal income rose 5% from 2007 to 2017. But the overall gain masks a sharp contrast in the experiences of U.S.-born Latinos – whose incomes in 2017 were 6% less than in 2007 – and of foreign-born Latinos, whose incomes were 14% higher than in 2007, according to a new Pew Research Center analysis of government data.
Demographic change, not the economic recovery, is the major driver of the gains for Latino immigrants. A slowdown in Latin American immigration led to a steep rise in the share who have lived in the United States for at least 10 years. Longer-tenured immigrants earn more than the typical immigrant, and their rising share gave a sizable boost to the average income of foreign-born Latinos. U.S.-born Latino workers – younger and less educated than U.S.-born workers overall – experienced greater losses in the recession and are left wanting in the economic recovery, despite recent gains.
Trends in the incomes of Hispanics
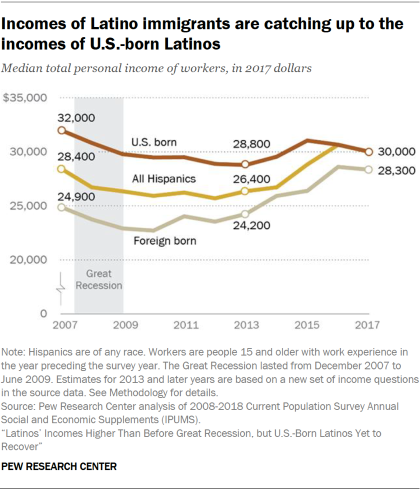
The incomes of Hispanic workers fell for several years following the Great Recession, reached bottom in or around 2013, and then took the path to recovery seen by American workers overall. The median personal income of Hispanic workers stood at $28,400 in 2007, at the cusp of the recession. By 2013, their median income had fallen to $26,400, a loss of 7%. A quick rebound followed this period of loss, and the median income of Hispanics rose to $30,000 by 2017 – a gain of 14% from 2013 to 2017, sufficient to make up for the recession-induced loss (incomes expressed in 2017 dollars).
However, U.S.-born Hispanics, who account for 52% of the Hispanic workforce and almost half of the growth in the U.S. labor force since 2008, have yet to recoup their Great Recession losses. Their median personal income, which was $32,000 entering the recession in 2007, reached a low of $28,800 in 2013, 10% less than in 2007. While incomes rebounded somewhat from 2013 to 2015 (reaching $31,000 in 2015), by 2017 they had dipped to $30,000 – 6% less than in 2007.
The fact that the incomes of U.S.-born Latinos remain below pre-recession levels is not because their economic recovery in recent years has lagged the recovery for others. Indeed, the median personal income of U.S.-born Hispanics increased 4% from 2013 to 2017, the same as the increase for U.S.-born workers overall. But these gains left U.S.-born Hispanics shy of a complete recovery from the Great Recession because they experienced greater financial losses in the economic downturn.
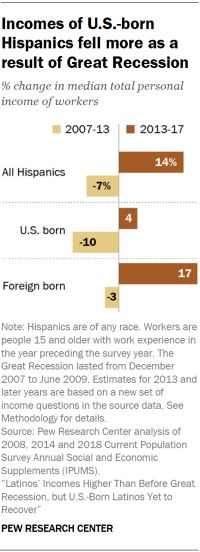
From 2007 to 2013, the 10% decrease in the median personal income of U.S.-born Hispanics was far greater than the 3% decrease experienced by U.S.-born workers overall. The relative youth and lower level of education of U.S.-born Hispanics are factors – U.S.-born Hispanic workers are more than five years younger than U.S.-born workers overall, on average, and 48% of U.S.-born Hispanics ages 25 and older have no more than a high school diploma, compared with 37% of all U.S.-born adults 25 and older, according to latest published data. Younger and less educated workers are more vulnerable in economic downturns, and the Great Recession was no different.
Compared with U.S.-born Hispanics, foreign-born Hispanics experienced smaller losses in the immediate aftermath of the Great Recession and greater gains in recent years. From 2007 to 2013, the median personal income of foreign-born Hispanic workers decreased by only 3%, from $24,900 to $24,200. This period of loss was followed by a gain of 17% from 2013 to 2017, with the median income of Hispanic immigrants increasing to $28,300. The sharp turnabout in the fortunes of foreign-born Hispanics is the driver of gains for Hispanic workers overall.
A slowdown in Latin American immigration contributed in large measure to financial gains for Hispanic immigrants
A key factor in the markedly better financial experience of foreign-born Latinos is the slowdown in the inflow of Latino immigrants, especially from Mexico. This sparked a major demographic shift – a sharp increase in the share of Latino immigrant workers who have lived in the U.S. for at least 10 years. As a result, Latino immigrants today, compared with 10 years ago, are older, more experienced workers who have spent significantly more time assimilating into the U.S. labor market. This demographic shift played a role in limiting financial losses during the Great Recession and boosting gains in recent years.
The deceleration in Latino immigration is related to the onset of the Great Recession. In the decade leading up to the recession, the number of foreign-born Latinos in the U.S. labor force increased by 50%, from 7.8 million in 1998 to 11.6 million in 2008, and immigrants accounted for a majority of the growth in the Latino labor force over this period. In the 10 years since 2008, the number of foreign-born Latino workers increased by only 15%, to 13.4 million in 2018, and the U.S. born accounted for more than seven-in-ten new Latino workers (see Methodology for the choice of dates).
The slowdown in Latino immigration is largely attributable to a decline in the inflow of unauthorized workers. In 1995, there were 2.6 million unauthorized Latino immigrants in the labor force, according to Pew Research Center estimates. The number peaked at 6.4 million in 2008 and subsequently fell to 5.9 million by 2016 (the latest year for which estimates are available). As a result, the share of the foreign-born Latino workforce in the country without authorization fell from 49% in 2008 to 44% in 2016.
The reduced share of unauthorized immigrants among Latino workers is akin to a selective withdrawal of lower-income workers from the workforce. This drawdown had a direct, albeit small, effect on the average income of Latino immigrants. The mean income in 2007 of Latino workers in the U.S. without authorization is estimated to be about 70% of the income level of Latino immigrants in the country legally, in part due to differences in education levels. Given that their incomes are lower, the 5-percentage-point decrease in the share of unauthorized workers from 2008 to 2016 alone would have raised the average personal income of Latino immigrants overall by about 2%.
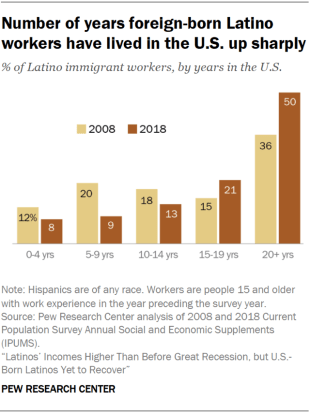
As the flow of new arrivals from Latin America slackened, the number of years Latino immigrants have been in the U.S. increased markedly. From 2008 to 2018, the share of Latino immigrant workers who had lived less than 10 years in the U.S. fell from 32% to 17%. Over the same period, the share of immigrant workers who had a tenure of 20 years or more in the U.S. increased from 36% to 50%.
This demographic shift resulted in a significant upward drift in the personal incomes of Hispanic immigrants. In 2007, the median income of Hispanic immigrant workers ranged from $19,000 for those in the U.S. less than five years to $31,200 for those in the U.S. at least 20 years. Even if the incomes of individual immigrants remained fixed at their 2007 levels, their average income would be 7% higher in 2017 due to the rise in the shares of workers who have lived longer in the country.
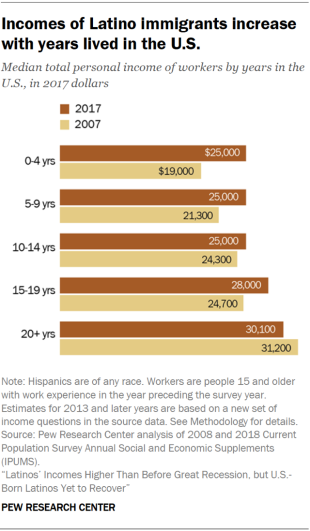
It is worth noting that newer arrivals among Latino immigrants reported much higher incomes in 2017 than in 2007. For example, immigrants in the U.S. for less than five years had a median income of $25,000 in 2017, compared with $19,000 in 2007. In part, this may reflect the higher level of education among these immigrants. In 2016, 34% of Latino immigrants ages 25 and older in the U.S. for five years or less had at least some college education, compared with only 22% in 2008 (the survey year in which 2007 income data were collected). It is likely that the reduced inflow of unauthorized immigrants also contributed to the gain in income. In 2008, 71% of Latino immigrants in the U.S. for five years or less were unauthorized. This share fell to 52% by 2016, the latest year for which estimates are available.
The trends in the personal incomes of Hispanics may explain why, despite record low unemployment and poverty rates, only 33% of Hispanic adults said their personal financial situation was in “excellent” or “good” shape in a 2018 Pew Research Center survey. This assessment was less positive than in 2015, when 40% of Hispanics said their personal financial situation was in “excellent” or “good” shape. The decline in Latino household wealth since the Great Recession – a median of $20,700 in 2016, versus $24,400 in 2007, both in 2016 dollars – may also have contributed to the decline in the rating of personal finances.
U.S.-born Hispanics, whose incomes are higher, were more likely than foreign-born Hispanics to say their personal financial situation was in “excellent” or “good” shape in 2018 – 41% vs. 25%. For both groups, this appraisal is more negative than in 2015, when 50% of U.S.-born Hispanics and 31% of foreign-born Hispanics reported that their financial situation was “excellent” or “good.” The rising pessimism among foreign-born Latinos echoes the finding that the recent growth in income for them is more a result of demographic change than a change in economic circumstances.
Trends in the incomes of whites, blacks and Asians
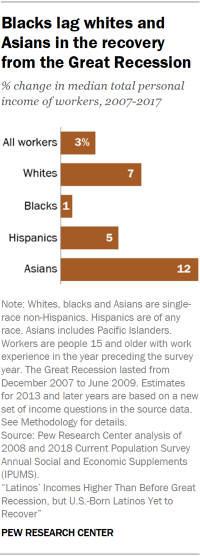
The weakness in the financial recovery for Hispanics is mirrored by the experience of blacks. The median personal income of black workers is virtually unchanged since the start of the Great Recession, inching up to $33,600 in 2017 from $33,200 in 2007. On the other hand, the financial recovery for whites and Asians has been stronger. The median income of white workers increased from $42,700 in 2007 to $45,500 in 2017 (up 7%) and the median income of Asian workers increased from $44,800 to $50,000 (up 12%).
The experiences of U.S.-born and foreign-born workers did not vary as dramatically among whites, blacks and Asians as they did among Hispanics. The median personal income of U.S.-born white workers increased 6% from 2007 to 2017, compared with a gain of 12% for foreign-born workers. The median incomes of both U.S.-born and foreign-born black workers were essentially unchanged over the period. Meanwhile, the median incomes of U.S.-born and foreign-born Asian workers increased 9% and 8%, respectively.
The slowdown in immigration that lifted the median income of Hispanics did not carry the same significance for other racial and ethnic groups. Only 5% of white workers were foreign born in 2018, compared with 4% in 2008. Among black workers, the share who were foreign born was 14% in 2018, compared with 11% in 2008. Because foreign-born workers make up small shares of white and black workers, changes in their incomes did not have a sizable impact on the changes in incomes for white and black workers overall.
Immigrants do play a large role in the Asian workforce, more so than among Hispanics, but there has not been a slowdown in immigration among Asians or a notable shift in their demographic composition. The share of Asian workers who are foreign born is relatively high, standing at 71% in 2018, compared with 74% in 2008. During this 10-year period, the number of Asian immigrant workers in the U.S. increased 36%, about the same as the 37% increase in the 10 years prior, from 1998 to 2008. Also, there was little change in the distribution of Asian immigrant workers by years in the United States. In 2018, 26% had lived in the U.S. for less than 10 years, compared with 29% in 2008, and the share who had lived in the U.S. for 20 years or more also changed modestly, from 41% in 2008 to 46% in 2018.
Be the first to comment