

The U.S. Hispanic population reached a record 59.9 million in 2018, up 1.2 million over the previous year and up from 47.8 million in 2008, according to newly released U.S. Census Bureau population estimates. Over the past decade, however, population growth among Hispanics has slowed as the annual number of births to Hispanic women has declined and immigration has decreased, particularly from Mexico.
Even so, Latinos remain an important part of the nation’s overall demographic story. Between 2008 and 2018, the Latino share of the total U.S. population increased from 16% to 18%. Latinos accounted for about half (52%) of all U.S. population growth over this period.
Here are some key facts about how the nation’s Latino population has changed over the past decade:
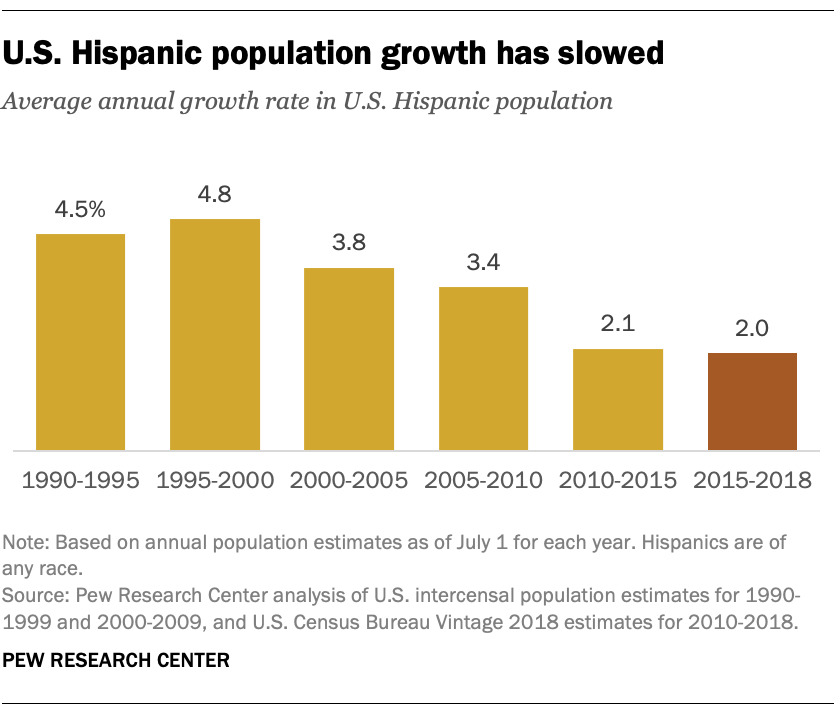
1Population growth among U.S. Hispanics has slowed since the 2000s. From 2005 to 2010, the nation’s Hispanic population grew by an average of 3.4% per year, but this rate has declined to 2.0% a year since then. Even so, population growth among Hispanics continues to outpace that of some other groups. The white population saw negligible growth between 2015 and 2018, while the black population had annual average growth of less than 1% over the same period. Only Asian Americans have seen faster population growth than Hispanics, with a 2.8% growth rate between 2015 and 2018. (All racial groups are single race, non-Hispanic.)
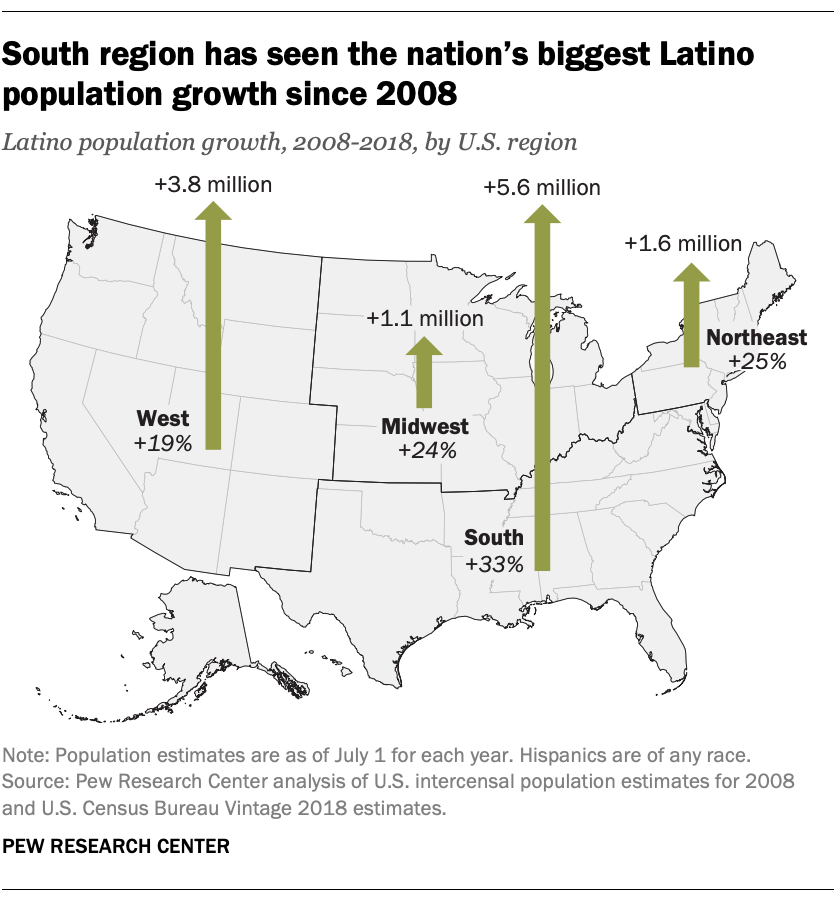
2The South saw the fastest Latino population growth of any U.S. region. The Latino population in the South grew 33% during this period, reaching 22.7 million in 2018, up 5.6 million from 2008. This growth was part of a broader increase in the Latino population in regions across the country since the 1990s. States in the Northeast (25% increase), Midwest (24%) and West (19%) also experienced growth in the number of Latinos from 2008 to 2018.
3The states with the fastest Hispanic population growth tend to have relatively small Hispanic populations – and are not in the South. North Dakota’s Hispanic population grew by 135% between 2008 and 2018 – from 12,600 to 29,500, the fastest growth rate of any state. However, the state ranked 49th among the 50 states and the District of Columbia in its overall Hispanic population in 2018. Hispanic populations in South Dakota (75%), the District of Columbia (57%), Montana (55%) and New Hampshire (50%) also experienced rapid growth during this period, though all have relatively small Hispanic populations.
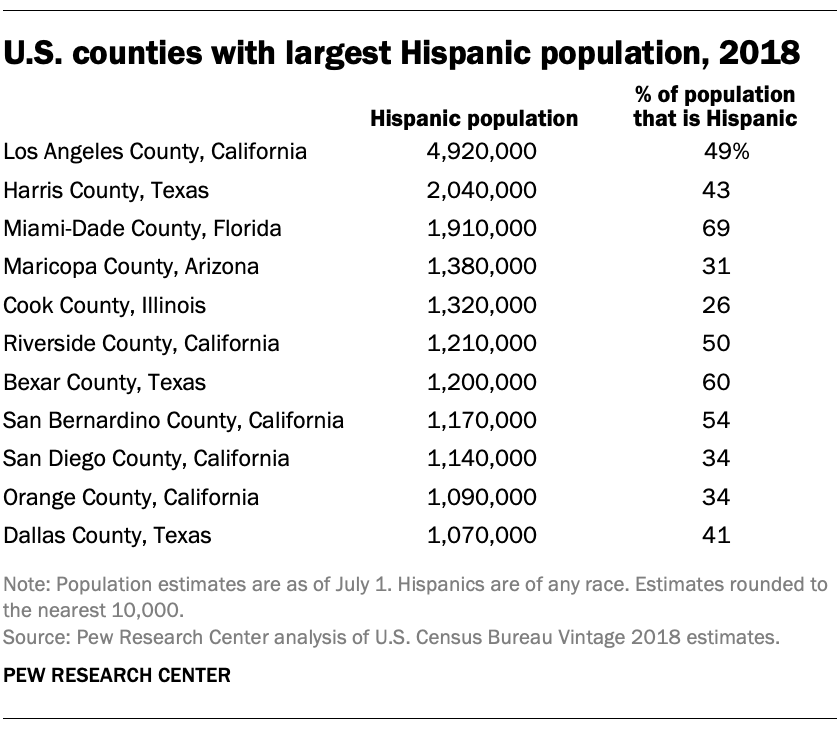
4Los Angeles County had more Hispanics than any other U.S. county, with 4.9 million in 2018. The next largest were Harris County, Texas (2.0 million), and Miami-Dade County, Florida (1.9 million). Overall, 11 counties had more than a million Hispanics in 2018; these include Maricopa County, Arizona; Cook County, Illinois; and Riverside County, California. In 102 U.S. counties, Hispanics made up at least 50% of the population in 2018.
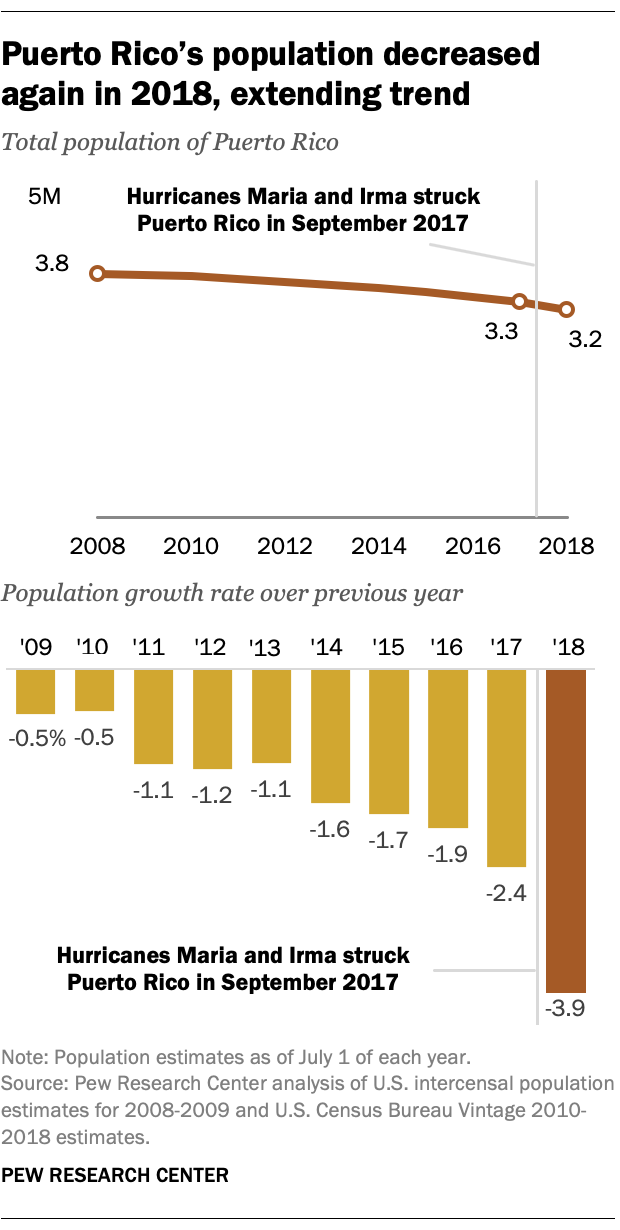
5Puerto Rico’s population declined nearly 4% in 2018 and is down about 15% since 2008. The island’s population stood at 3.2 million in 2018, down from 3.3 million in 2017, when hurricanes Maria and Irma hit. The two disasters led many Puerto Ricans to leave for the U.S. mainland, especially Florida. Even before the hurricanes, however, the island’s population had experienced a steady, long-term population decline due to a long-standing economic recession.
6Latinos are among the youngest racial or ethnic groups in the U.S. but saw one of the largest increases in median age over the past decade. Latinos had a median age of 30 in 2018, up from 27 in 2008. Whites had the highest median age nationally – 44 in 2018 – followed by Asians (37) and blacks (34). The median age for both Latinos and whites has increased by three years since 2008, tying for the largest uptick of any racial or ethnic group.
Be the first to comment